

Inequality is Bad for the Economy
Inequality is Bad for the Economy
Doubly so

There are benefits to a democratic society in reducing the misery of its poorest people. The case was made during the Reagan administration for so-called “trickle down” economics — the idea that money in the hands of the wealthy will find its way into the pockets and pocketbooks of the less well off. But this was discredited as mere wishful thinking by the wealthy and their surrogates. Nevertheless, those who advocate for less government continue to assert that less taxation of the wealthy is good for the economy. However, much research has disproved this myth.
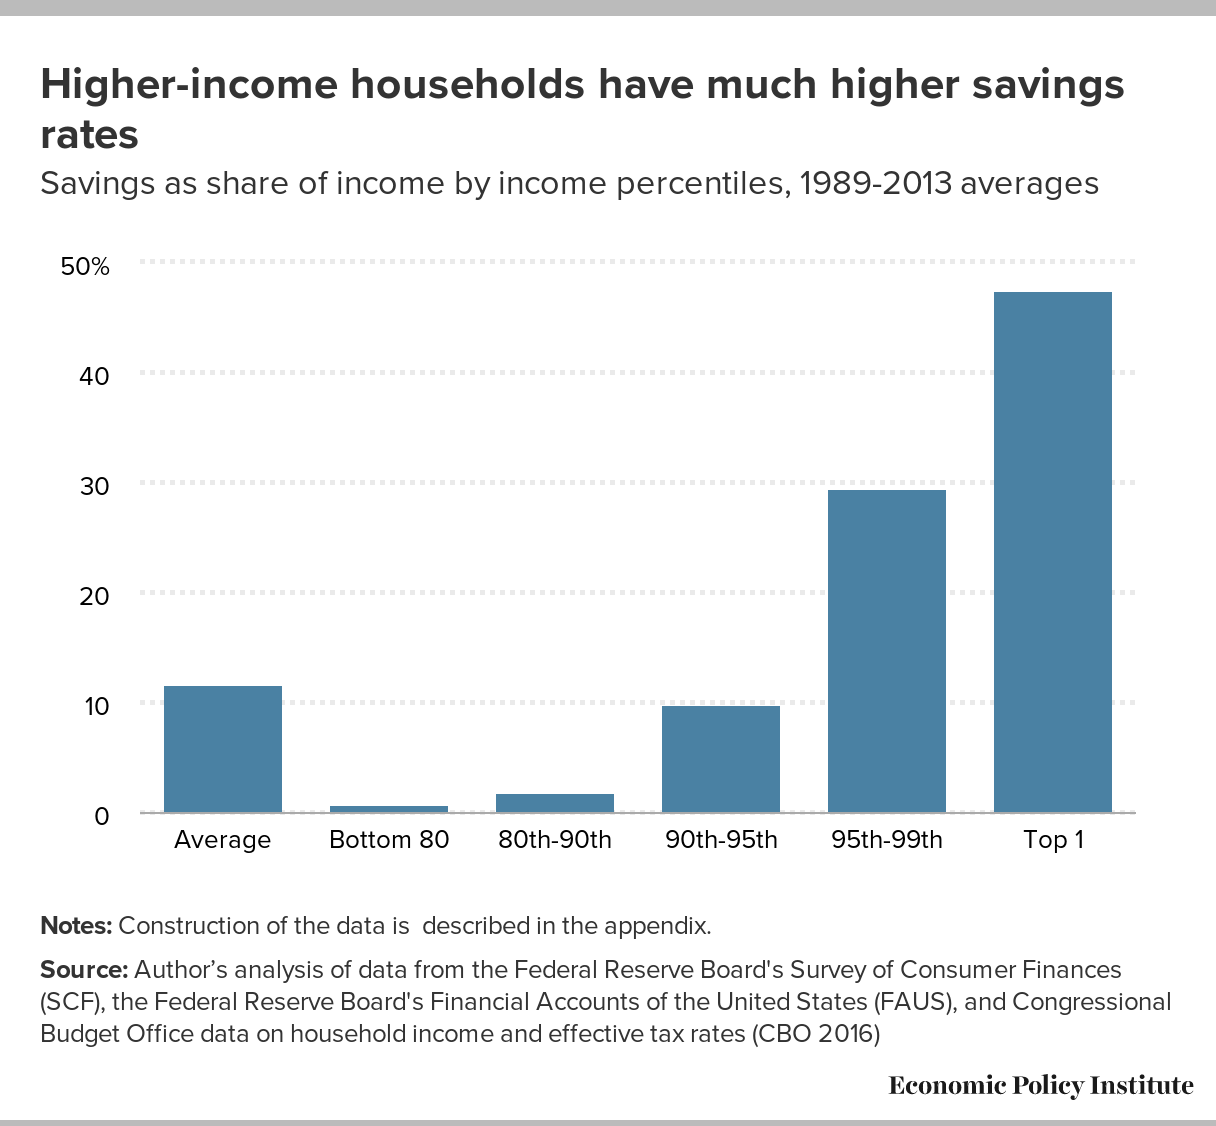
Part of the reason why taxation of the wealthy to fund social programs benefiting the least well off is good for the economy is that a dollar in the hands of a poor person is more likely to be spent than a dollar in the hands of a wealthy person. Accumulating wealth rather than spending it may be a noble discipline, but it does much less to stimulate economic growth as compared to spending.
There are many more reasons why reducing economic inequality is good for the economy, including that more young people are able to obtain more education, rather than being locked out by the cost. With more skilled labor available, more growth is possible.
Acknowledging that some level of inequality can be good for a developing nation’s economic growth — envy theoretically inspires accomplishment — too much inequality inhibits growth. As one meta-study revealed, from 1990 to 2010, rising inequality reduced the growth of Gross Domestic Product (GDP) in the U.S. by five percent. Think about that. U.S. GDP in 2010 was 15 trillion dollars, which is equivalent to over 19 trillion dollars today. Five percent of that is 956 billion dollars (in today’s value) that was not circulating in the economy. That’s $3100 for every person in the country at that time.
But it gets worse. More recent research asserts that increasing inequality since that time drags GDP growth by at least two percent annually, and possibility by as much as four percent. In the past ten years, with compounding, that’s at least 22 percent of GDP. If inequality had had the same drag on the economy over the past ten years as it did between 1990 and 2010, it would have amounted to only 2.5 percent in total during that time. Instead, it’s at least 22 percent. Rounding the difference gives us 20 percent more drag than we’d have had if inequality had remained at this earlier level. In 2021, U.S. GDP measured 23.2 trillion dollars. 20 percent of that is 4.64 trillion dollars. That’s a staggering 14,000 dollars for every person in the United States as of December 1, 2021. That money is not in circulation, not improving people’s lives and wellbeing, and would have been there but for growth of economic inequality since 2010. When people say we can’t afford programs that are proven to raise living standards, such as early childhood education, child care, and a guaranteed minimum income, here’s proof that we can’t afford not to make these investments.
If you prefer to see this in starkly partisan terms, consider that when the GOP is in power, their policies largely favor tax breaks, especially for the wealthy. When the Democrats are in charge, their policies instead favor social welfare programs aimed at those with incomes below the national average. Put another way, by NY Times opinion writer David Leonhardt, “Democrats have been more willing to heed economic and historical lessons about what policies actually strengthen the economy, while Republicans have often clung to theories that they want to believe — like the supposedly magical power of tax cuts and deregulation. Democrats, in short, have been more pragmatic.”
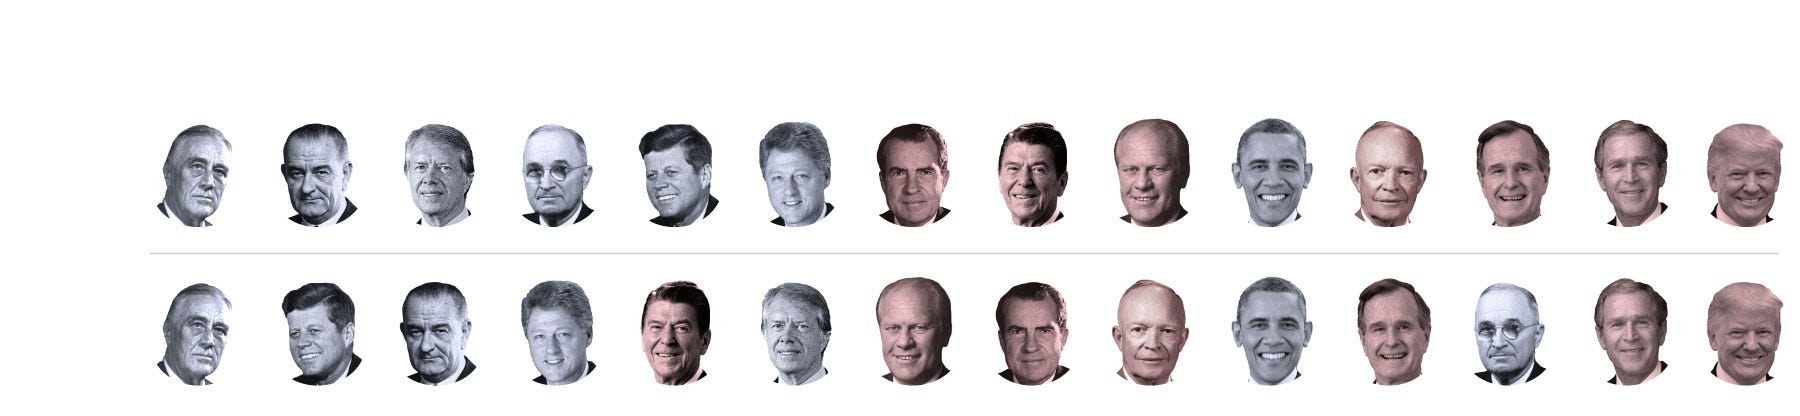
The result? “The annual growth rate of nonfarm jobs increased by 2.8 percentage points under Democratic presidents elected since 1933, compared to just 1 percent under GOP presidents during the same time period. Similarly, America's GDP grew annually at 4.6 percent under Democrats, compared to 2.4 percent under Republicans. If the U.S. economy had grown at the increased rate seen under Democrats since 1933, the average income of Americans would be more than double its current level.” Double.
Ranking of U.S. Presidents from left to right. Democrats are in black and white, while Republicans are more colorful. GDP growth is the first row. Nonfarm job growth is the second row.
To be fair, a study by the same researchers comparing Presidents from Truman to Obama notes that economists have not formed a consensus about the reasons for this difference in economic growth. Nonetheless, the Democrats have a public policy difference that produced 2.2 percent more growth, compounded annually over 48 years of Democratic administrations, and trickled down to our workforce. If the policies of Democrats had been in place for 88 years, we’d have a far more robust economy than we have today. With that result, we likely would not be having a debate about how to fund physical and social infrastructure spending.